Compare location results with demographic, customer, competitive, and local-market context.
Find the answer.
Then get back to the business.
CentriPOS brings your operating numbers and the surrounding market into one place, with help that meets your team on the page they are already using.
FOUR VIEWS OF WHAT DESERVES ATTENTION
Clarity that reaches beyond a dashboard.
CentriAI works alongside four connected intelligence areas so owners can move from a signal to the people, places, and work behind it.
See team and individual activity, response patterns, and outcomes with the operational context intact.
Surface reputation signals, help collect new reviews, and put feedback in front of the right people.
Understand what was saved, why it paused, who needs follow-up, and how much possible revenue is waiting.
Reports that stay close to the work.
Sales Reports, Register Reports, saved views, inventory reporting, payment reporting, and network performance share the same operational context.
See where customers come from.
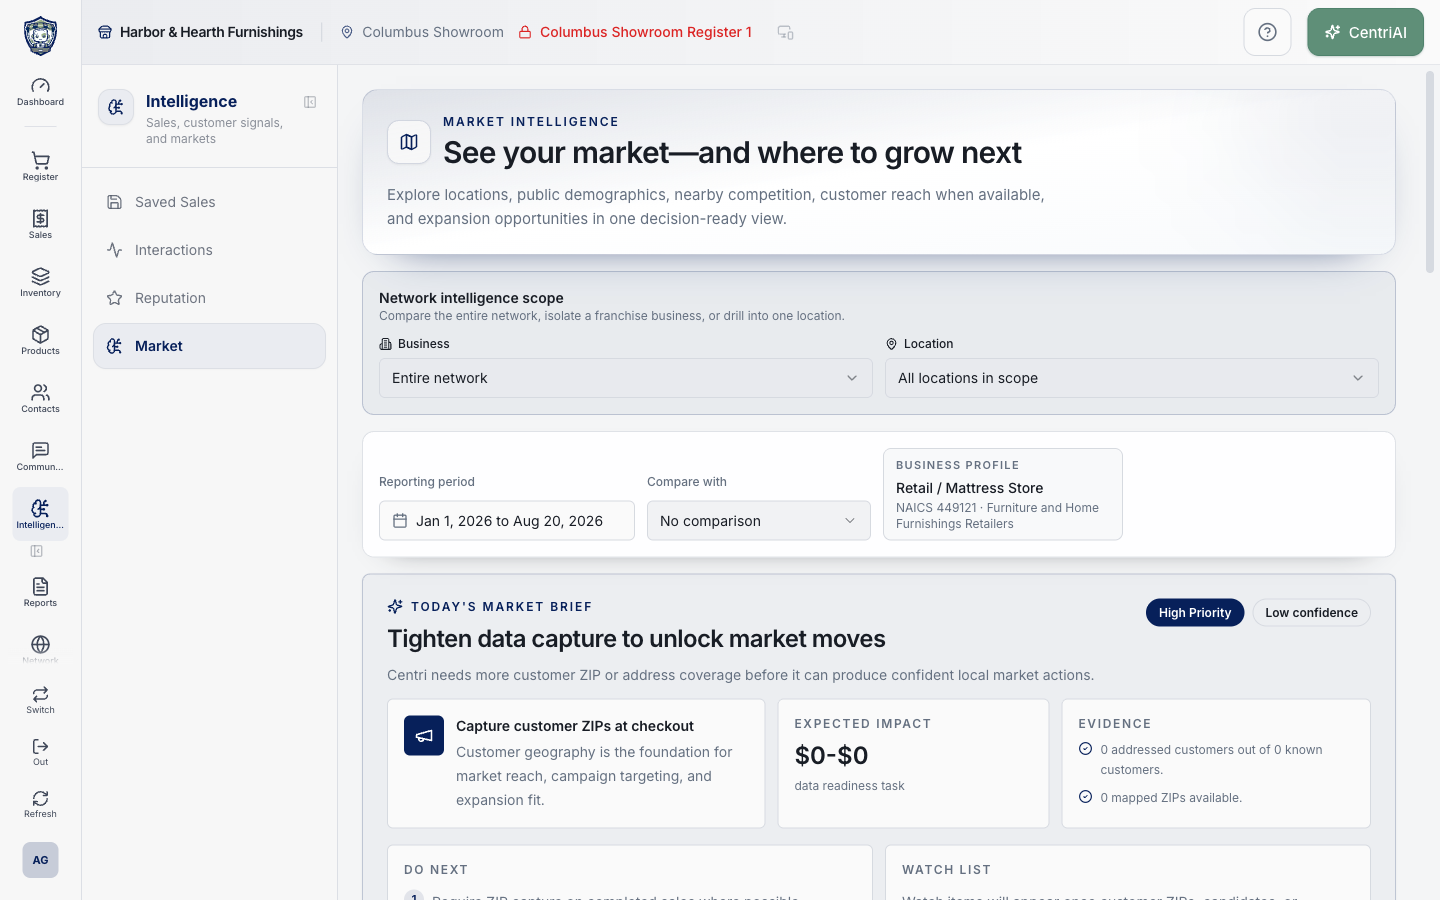
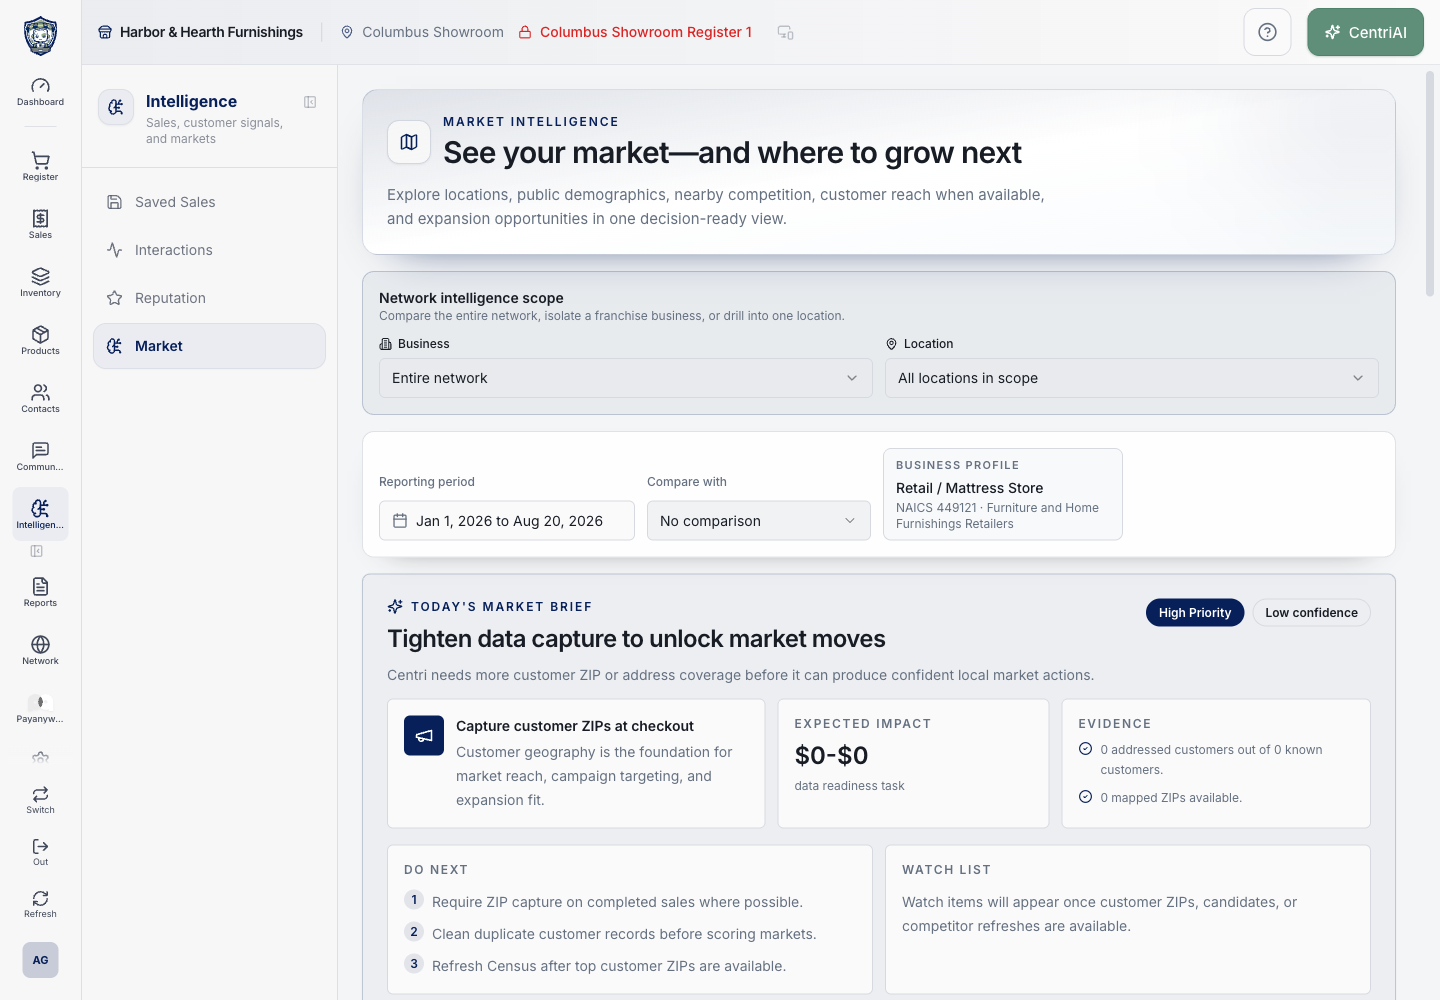
Market Intelligence connects customer geography, ZIP reach, Census baselines, nearby competition, expansion signals, and growth-plan bookmarks.
Ask Centri from the page you are on.
Find a receipt, understand Market Intelligence, work through a register session issue, or get help connecting a customer display without leaving the workflow.
Real Harbor market viewEvidence before recommendationsFROM DATA READINESS TO A DECISION
Know what the system knows—and what it still needs.
Market Intelligence does more than draw a chart. It shows the reporting scope, confidence, evidence, missing data, and the next practical steps that will make future recommendations stronger.
- Compare the network, a business, or one location
- Connect customer and fulfillment ZIPs to revenue
- Pair operating results with public Census context
- Review competition, market fit, and expansion candidates
- Carry the current market brief directly into CentriAI
THE DETAIL BEHIND THE BRIEF
See the evidence, not just a headline.
Open customer reach, revenue concentration, market baselines, nearby competition, confidence indicators, and the operating records that support the recommendation. The result is a practical view an owner can question, share, and act on.
THE OPERATING STORY BEHIND THE TOTAL
Move from a number to the location, customer, or product behind it.
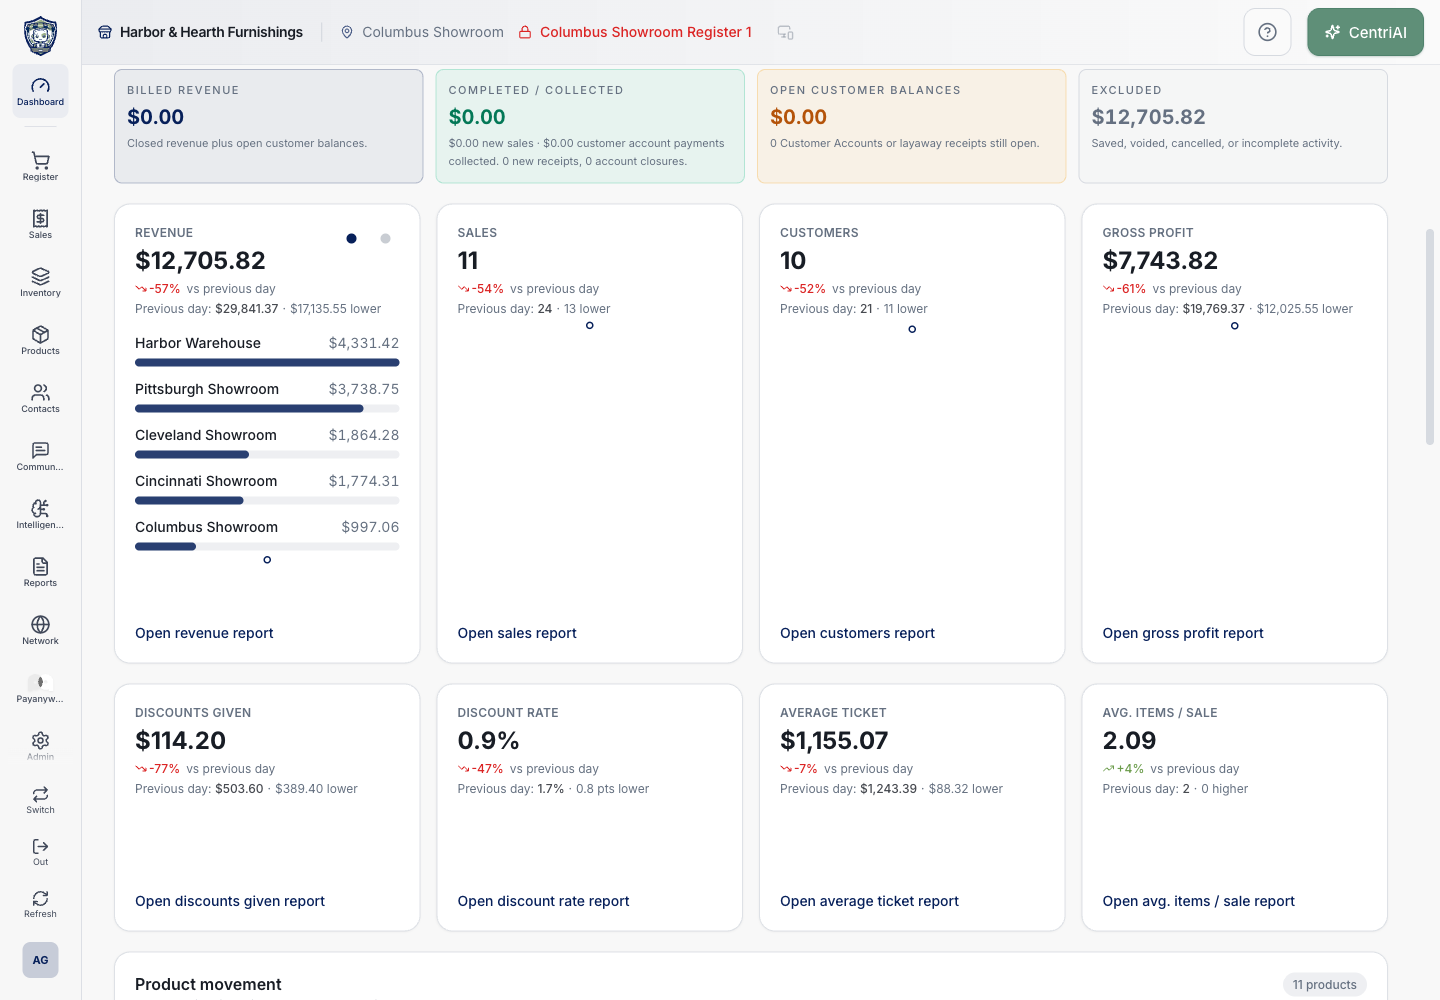
The same records power daily reporting and network intelligence. Leaders can compare revenue, sales, customers, gross profit, average ticket, discounts, payment mix, and product movement—then open the underlying report instead of guessing.
- Day, week, month, and year comparisons
- One-location and all-location views
- Revenue and gross-profit context
- Customer, inventory, and fulfillment signals
 Location and network scopeOpen the report behind the answer
QUESTIONS AN OWNER CAN ACT ON
More than “How did we do?”
Use connected sales, customer, inventory, fulfillment, interaction, and market records to understand where revenue comes from, where opportunities stall, which locations need support, and what deserves attention next.
DECISION PROMPTSAsk a better next question
- Which locations changed most this month?
- Where are saved or abandoned sales building up?
- Which ZIPs drive the most completed revenue?
- Where is inventory sitting while another store needs it?
- What should the team follow up on today?
Know what is happening—and why.
We’ll show you the reporting and intelligence that matters for your business.